

Analysis updated 6 November 2026 · Official ACARA data · Australia and Victoria
What the 2026 results actually show
The national picture is broadly steady, with different patterns underneath it. Older year groups have higher numeracy averages than in 2023, while national reading averages in Years 5, 7 and 9 are lower than in 2025. These are useful signals about the learning system. They do not establish that a particular child has improved or fallen behind.
Our analysis uses ACARA’s 2026 national-results workbook, filtered to All students for Australia and Victoria. We compare like year levels and domains. “Strong or Exceeding” combines the two highest proficiency categories. It is a percentage of the reported group, not the percentage of questions answered correctly, and not an ATAR prediction.
Graph 1: how Victoria compares with the national picture
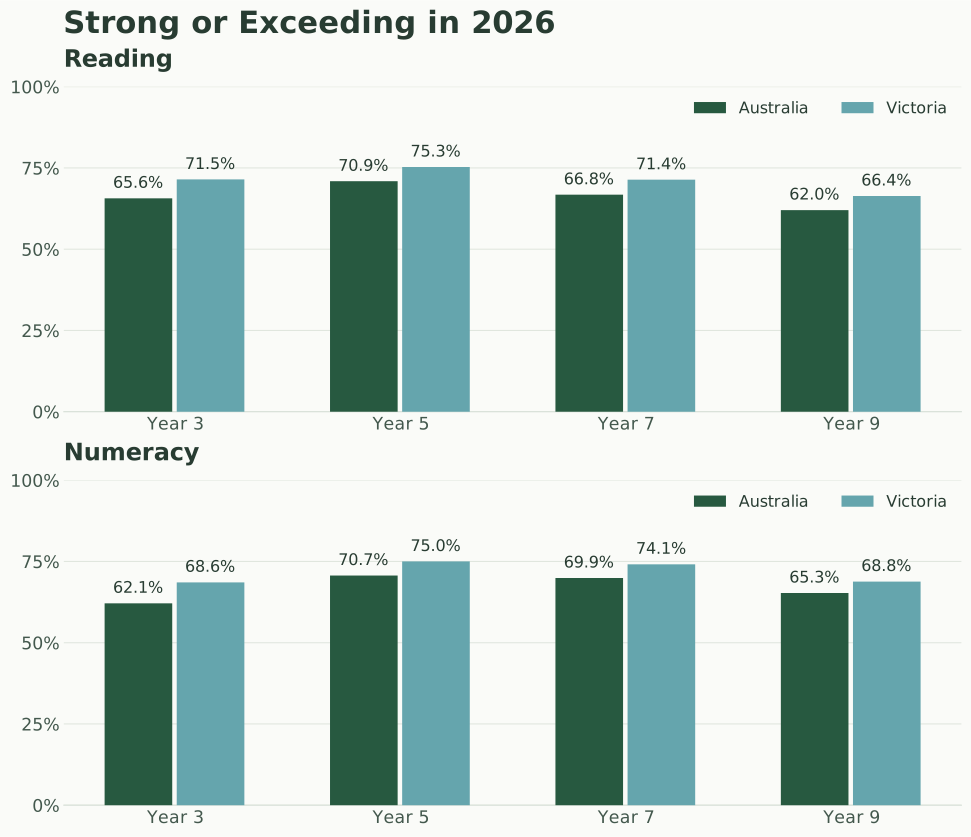
Source: ACARA, NAPLAN Results sheet, 2026, All students. Percentages are shown on a 0–100% axis. Download graph (PNG).

| Year | Domain | Australia | Victoria |
|---|---|---|---|
| Year 3 | Reading | 65.6% | 71.5% |
| Year 3 | Numeracy | 62.1% | 68.6% |
| Year 5 | Reading | 70.9% | 75.3% |
| Year 5 | Numeracy | 70.7% | 75.0% |
| Year 7 | Reading | 66.8% | 71.4% |
| Year 7 | Numeracy | 69.9% | 74.1% |
| Year 9 | Reading | 62.0% | 66.4% |
| Year 9 | Numeracy | 65.3% | 68.8% |
Interpretation: Victoria’s percentages are higher in each of these eight comparisons. In Year 3 numeracy, the gap is about 6.5 percentage points. That describes two populations with different characteristics; it does not measure the effect of living in Victoria, a school’s quality, or a tutoring program. A child in either state can have a strong result in one domain and need support in another.
What to do with this: use the national and state markers on your child’s report as context. Then ask which specific reading or numeracy skill appears in current classwork. A state average is too broad to set an individual learning goal.
Four-year trends: numeracy and reading are moving differently
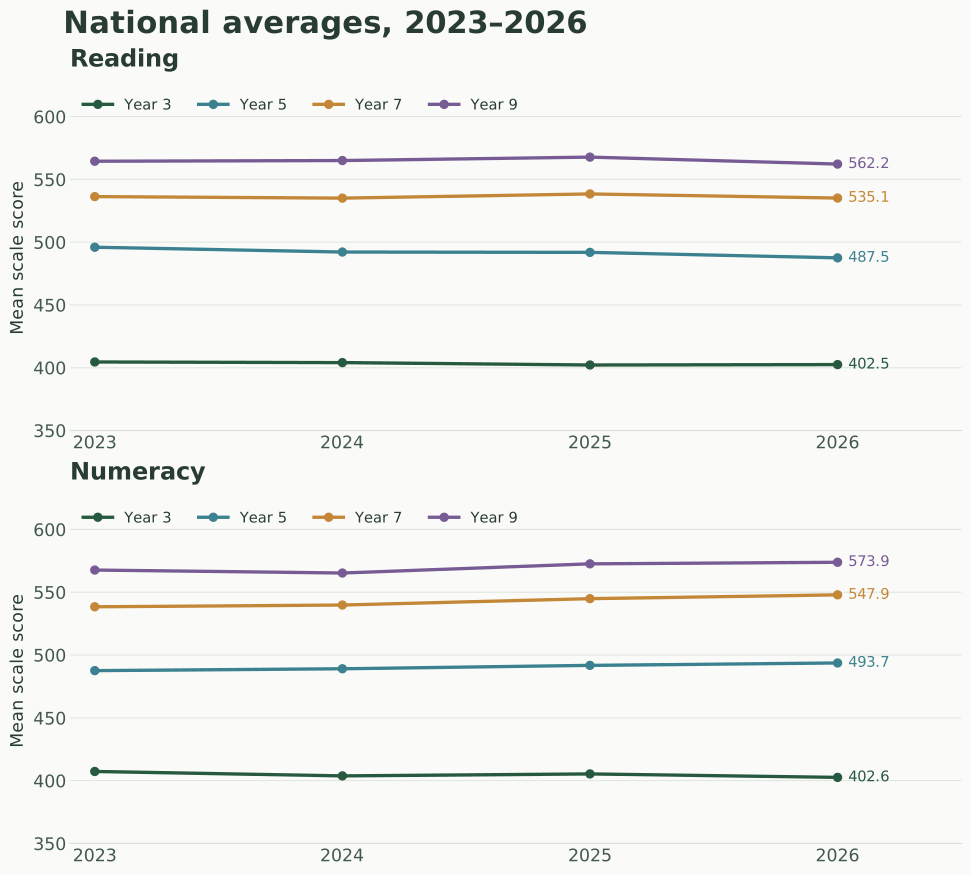
Source: ACARA, NAPLAN Results sheet, 2023–2026, Australia, All students. Vertical axes use the same 350–625 scale-score range; these are not percentages. Download graph (PNG).

Year 7 numeracy rose from 538.4 in 2023 to 547.9 in 2026; Year 5 numeracy rose from 487.6 to 493.7. Year 3 numeracy moved in the other direction, from 407.3 to 402.6. This makes foundations such as number magnitude, place value and explaining operations sensible topics to discuss when a younger child’s schoolwork shows a gap. The national data alone cannot identify which of those skills a child needs.
Reading deserves attention too. National Year 9 reading fell from 567.7 in 2025 to 562.2 in 2026, a difference of about 5.5 scale points. Reading in Years 5 and 7 also declined numerically. This is a reason to investigate students’ comprehension needs, not evidence that each child’s reading deteriorated.
A numerical change can be statistically detectable and still small
ACARA’s comparison workbook records statistical significance separately from the size of the difference. For example, the Year 9 reading change is statistically significant, while its “nature of difference” is classified as negligible. All eight 2025–2026 national mean-score comparisons shown here have that negligible-size classification. Avoid describing small changes as a learning “collapse” or a “surge”.
The lines follow successive Year 3, Year 5, Year 7 and Year 9 groups. They do not follow the same children through school. To discuss growth, compare your child’s own evidence over time and, where appropriate, the separate cohort-gain information. NAPLAN’s scale reset in 2023 also means these results should not be spliced into a pre-2023 trend.
Where additional support is needed varies by domain
The national average can conceal very different needs. The table below shows the percentage in the Needs additional support category in 2026. It is one proficiency category, not the share of students who could benefit from teaching or extension. Developing students may also need targeted help.
| Domain | Year 3 | Year 5 | Year 7 | Year 9 |
|---|---|---|---|---|
| Reading | 11.3% | 7.7% | 10.7% | 11.1% |
| Writing | 6.7% | 10.3% | 12.5% | 12.8% |
| Spelling | 11.2% | 8.4% | 7.7% | 7.7% |
| Grammar and Punctuation | 16.3% | 12.2% | 15.4% | 15.6% |
| Numeracy | 11.0% | 7.6% | 9.0% | 11.0% |
For example, Year 3 writing has 6.7% in this category, while grammar and punctuation has 16.3%. These domains test different aspects of learning. Do not average a child’s domain labels into an invented overall NAPLAN grade. A spelling difficulty, difficulty interpreting a sentence and difficulty structuring an argument call for different follow-up tasks.
Two important limits on the 2026 figures
- Writing: a platform disruption affected many Years 5, 7 and 9 students on 11 March. ACARA reports that national writing results remain valid, but effects varied between students and schools. Read any caveat on your child’s report and discuss the test-day experience before treating writing as a precise diagnosis.
- Participation: ACARA suppressed Tasmania’s 2026 achievement results because participation was too low for valid reporting. The published national estimates are still reported, but participation is a reminder that these figures describe a measured population, not a complete account of every Australian child.
We retain ACARA’s published denominators. Exempt students are reported separately in the workbook, so the four proficiency percentages should not automatically be renormalised to add to 100%. Neither of the charts ranks schools or predicts an individual child’s future results.
Make the next step specific to your child
Start with the domain, then identify an observable task. For reading, ask the child to find a claim, choose evidence and explain an inference in a short text. For numeracy, ask them to estimate an answer, solve the problem and explain why it is reasonable. These are examples of follow-up activities, not deductions from a NAPLAN score.
| Report category | Useful conversation | Evidence to collect |
|---|---|---|
| Needs additional support | Which prerequisite skill is preventing access to current work? | A teacher-selected task, the child’s explanation and a short follow-up after teaching. |
| Developing | Which recurring error would make the biggest difference if resolved? | Several comparable examples showing whether the same error persists. |
| Strong | Can the child explain and transfer the method to unfamiliar questions? | A mix of routine and new tasks, with written reasoning. |
| Exceeding | What appropriate extension would deepen the child’s thinking? | Richer problems and explanations, rather than more repetitive questions. |
A practical four-week review might start with one teacher-agreed skill in week 1, a few short practice sessions in weeks 2 and 3, and a fresh comparable task in week 4. Record independence, explanation quality and repeated errors. This is a suggested review routine, not a promise of a particular score gain. If the gap remains, adjust the instruction or seek more targeted support.
Check the data and sources
Download the chart data (CSV, 64 rows). Chart values come from the workbook’s published “Strong or above (%)” and “Average NAPLAN score” fields, not a simple average of states. Percentages and means are displayed to one decimal place; calculations use the unrounded values. Small residuals in published national percentage totals are retained. Charts and interpretation: Super Tutors.